Dashboard Design
Design is the first Tab on the Edit Dashboard panel. There you can specify the color palette for all graphic charts.
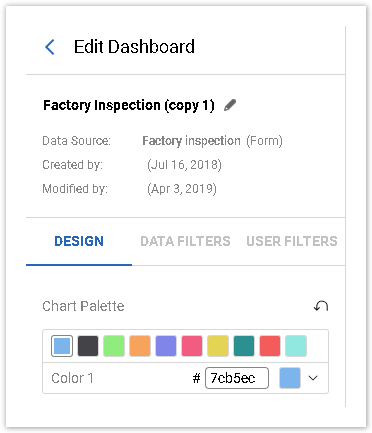
To do so, select each color and specify its color hex code, or click on the arrow next to the color to choose it manually:
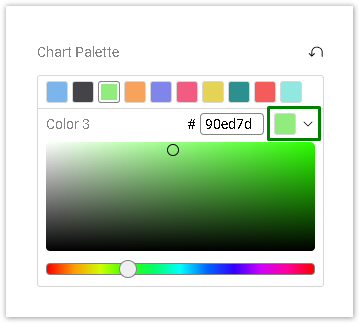
A color hex code is a way of specifying color using hexadecimal values. The code itself is a hex triplet, which represents three separate values that specify the levels of the component colors. The code starts with a pound sign (#) and is followed by six hex values or three hex value pairs (for example, #AFD645).
The Reset button located in the top-right corner, returns to the default colors.
Dashboard-level design settings are inherited by all charts in the Dashboard. If you would like to apply individual design settings for a specific chart, please go to the Design Tab on the Edit Chart panel.