Data Filters
Data Filters allow to limit the data displayed in a Dashboard and display only those responses which satisfy the filter criteria.
Responses which do not satisfy the filter criteria will not be displayed in charts and tables.
Filters can be based on:
a. System fields & Task properties
b. Questions
c. Answer options
b. Cells of 3D Matrix
How to create a Data Filter
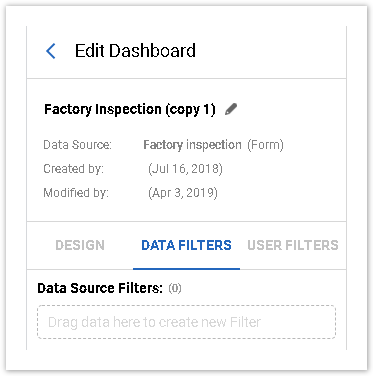
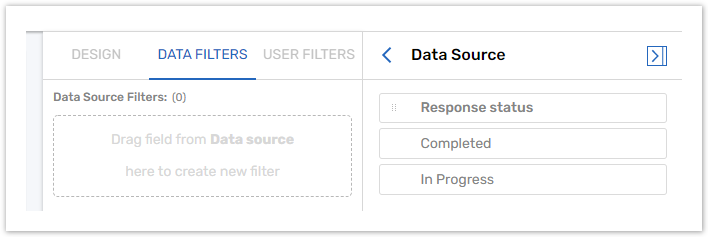
Go to the Edit Dashboard panel and switch to the Data Filters tab:
Open the Data Source panel;
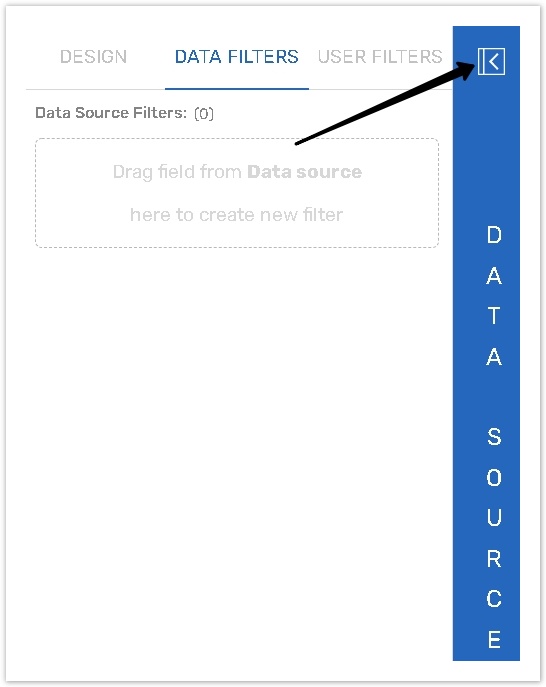
Drag and drop data from the Data Source panel. Filter can be based on any data from the Data Source panel.
.png?inst-v=5c056e1e-ae23-46ea-99ee-f3d1279e23b0)
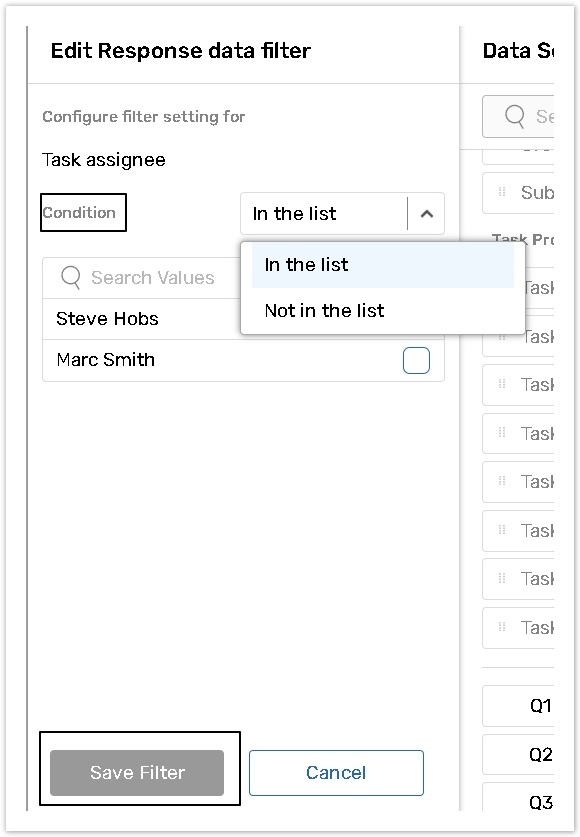
After you drag data from the Data Source panel, you can select the condition of a filter. The list of conditions depends on the selected Data Source.
For example, the Data Source from the Single line text with pre-format options question type has the following condition options:
%20(2).png?inst-v=5c056e1e-ae23-46ea-99ee-f3d1279e23b0)
The Data Source from the Pick one or 'other' question type has the following condition options:
%20(2).png?inst-v=5c056e1e-ae23-46ea-99ee-f3d1279e23b0)
Then click the Save Filter button to go back to the Edit Dashboard panel.
To check or edit its settings, click the Settings (1) icon. To remove the filter, click Delete (2).
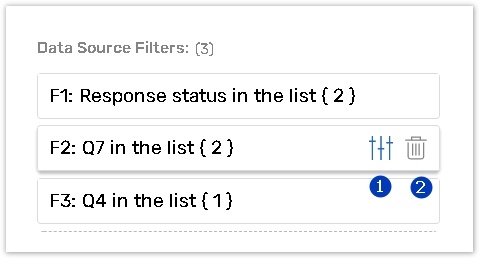
If you have applied multiple filters, the AND logic will be used between them. Filters are applied from top to bottom.
Filter responses by the Response Status
Dashboards displays both Submitted and In Progress responses by default. However, you can filter responses by their Status.
![]() Depending on the filter type, you can drag different questions. Those that can be used in the chart or filter will have the following mark next to them.
Depending on the filter type, you can drag different questions. Those that can be used in the chart or filter will have the following mark next to them.
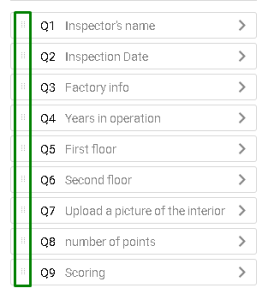
In some cases, you might not be able to add the whole question to the filter but only its elements. Click on the question to see the elements that can be used for creating a chart or filter.