Chart Dimensions
Dimensions are used to break down the calculated values into specific categories in a chart or table and help to focus on different groups of data.
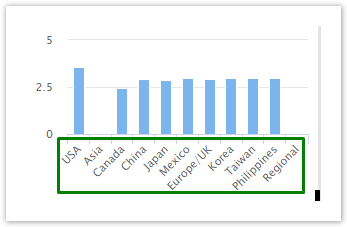
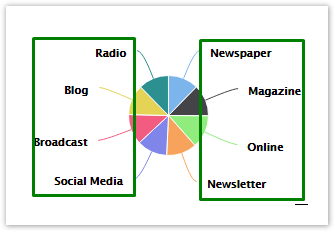
Dimensions appear on the x-axis for bar and line charts, or as slices in a Pie chart, or as rows and columns in Crosstabs.
On the Edit Chart panel, dimension fields are displayed right after the value fields, and are labeled differently for each Chart type:
Horizontal/Vertical Bar Chart - Show by
Line Chart - Show by
Pie Chart - Slices
Crosstab - Rows and Columns
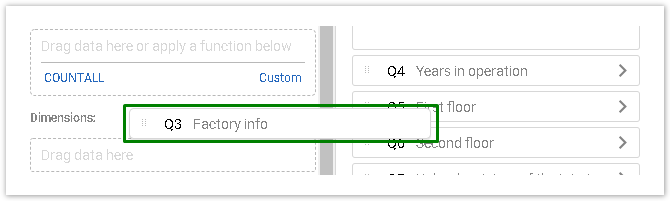
To add a Dimension to a chart, drag a question, answer option, column or a system field from the Data Source panel to the Edit Chart panel:
Different types of Charts have their own limitations on the number of dimensions that can be added:
Bar Charts - max 2 dimensions
Line Chart - max 2 dimensions
Pie Chart - max 1 dimension
Crosstab - max 400,000 cells
Table - max 2000 columns
More details can be found in the Chart Types chapter.
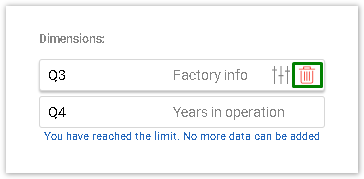
To remove the added dimension, click the Trash button which appears on hover:
Dimension Types
Questions, answer options, columns, cells and system fields can all be used as Dimensions. Depending on the dimension level and the type of question used, the generated dimensions will be different. Below is the full description of how dimensions are generated for various question types and dimension levels.
Question Level Dimension
Qx
Based on the question type used as a dimension, the behavior is as follows:
Question types | How dimensions are generated |
Pick one, Check all, Dropdown, List box, Single line, Numeric allocation, File upload |
|
Rating scale, Matrix |
|
Object Lookup, Multiple Object Lookup |
|
Multi-line text response |
|
Answer Level Dimension
Qx.Ay
This type of dimension may be applied to most question types, except 'Section Header', 'Compare one against another', 'Multi-line text response' and 'Multiple Object Lookup'. Based on the question type used as a dimension, the behavior is as follows:
Question types | How dimensions are generated |
Pick one, Check all, Dropdown, List box |
|
Single Line, Numeric Allocation, Object Lookup, File Upload, 'Other' or 'Comment' field in Pick One or Check All questions |
|
Rating scale, Matrix |
|
Cell Level Dimension
Qx.Ay.Cz
This dimension type applies only to the 'Rate different items along the scale of your choice' and '3D Matrix' question types.
Question types | How dimensions are generated |
Rating scale |
|
Matrix - Pick One or Check all column |
|
Matrix - Text column |
|
Matrix - Dropdown column |
|
Column Level Dimension
Qx.Cz
This dimension type applies only to 'Rating scale' and 'Matrix' question types.
Question types | How dimensions are generated |
Rating scale, Matrix |
|
Dropdown Option Level Dimension
Q1.A1.C1.O1
This dimension type applies only to Dropdowns in Matrix questions.
Question types | How dimensions are generated |
Dropdowns in Matrix |
|
System Field Level Dimension
The system fields of the form (such as Response ID, Code, Submit Date, etc.) can also be used as dimensions.
System field | How dimensions are generated |
Response ID, Response Label, Code, Create Date, Submit Date, etc. |
|
Dimensions Settings
Sorting Order
When you create a chart or table, data is sorted automatically depending on the type of Question added as a dimension. If a question is closed-ended, the data is sorted by the order of answer options in a question. If the question is open-ended, then responses are sorted alphabetically.
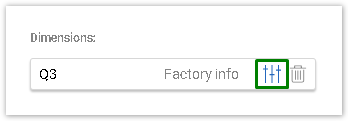
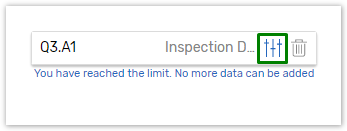
If you need to sort data in another order, go to the Chart Edit panel, hover over a dimension and click the Settings button:
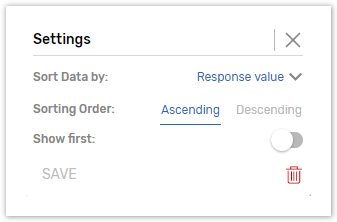
There you will see two options: Sort data by and Sorting Order. Ascending is the default sorting order.
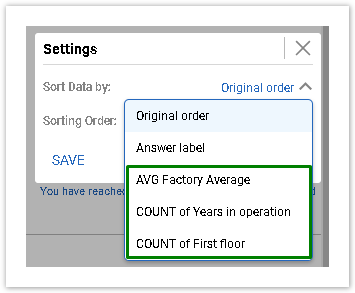
You can sort data by Original order, by Answer label/Column Label/Response Value or by Chart Values.
Original order - same as the order of answer options as in the form's question. This option appears only if a closed-ended question is added as a dimension.
Answer label/Column Label/Response Value - this is the alphabetical sorting of the mentioned elements. For Pick One or Other, Check All that Apply, Dropdown box, List Box questions and answers of Rate and Matrix questions the Answer label will be shown. If a Rate or Matrix column is added as a dimension, you can sort by Column label. If an open-ended question is added as a dimension, you can sort data by Response value:
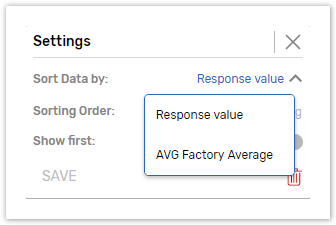
Chart or Table Values - you may also sort data in your Chart or Table based on the Values you have added. All values will appear in the Sort Data by dropdown after the options, mentioned above:
Dates in Dimensions
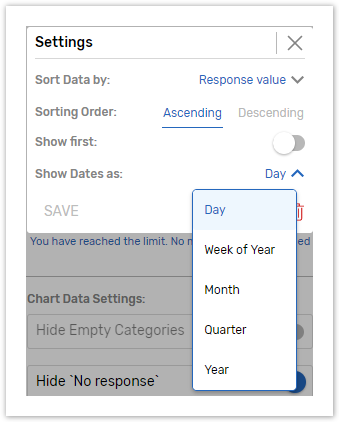
If one of your fields in a Single Line or Matrix question stores a date, you may add this field as a dimension. If the Date field is used, an option appears next to this dimension which allows you to group dates entered into this field.
The dates can be grouped by days (default option), week of the year, month, quarter and year:
Show First
It is possible to limit the data shown in a chart to the most significant/biggest values only.
This can be done to all types of charts for which the sorting functionality is available.
After the sorting is applied in the Dimensions settings, use the Show first toggle button to set the number of top values that will be seen by a viewer.
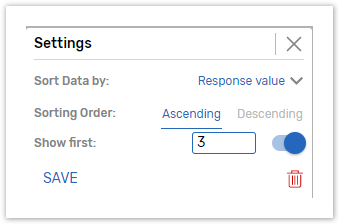
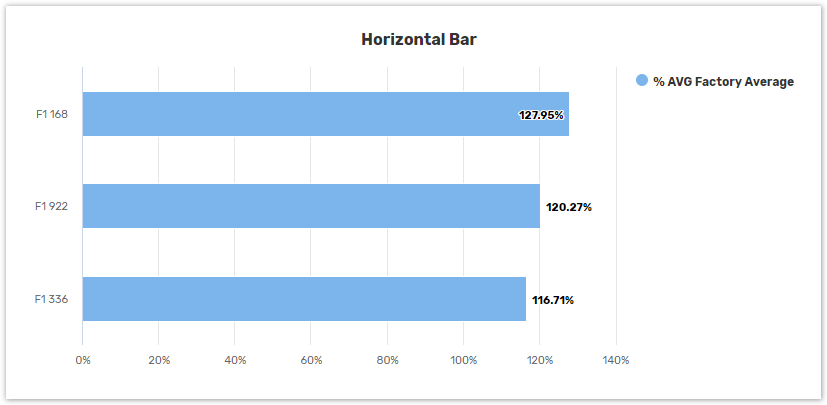
Here is the example of a horizontal bar chart that shows the inspection scores of factories (presented as an average score for each of the factories inspected):
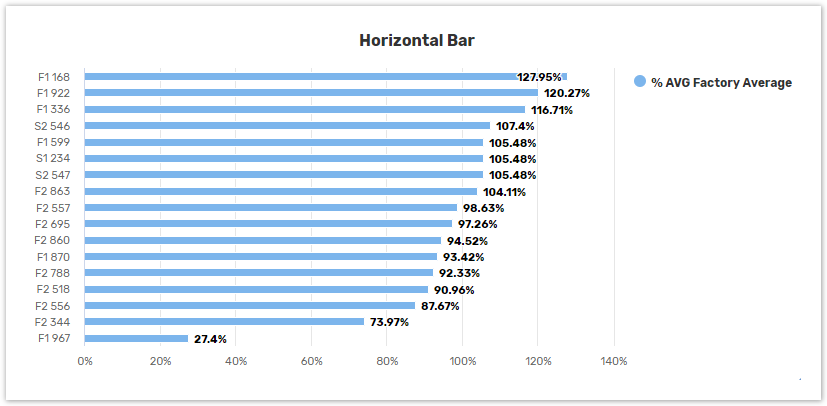
After we apply sorting and set the 'Show first' option to a number '3' in the Dimensions settings, the chart will show only the top three scores: