Charts
The article covers functions and features of the Dashboard in the form of charts.
How to create a Chart
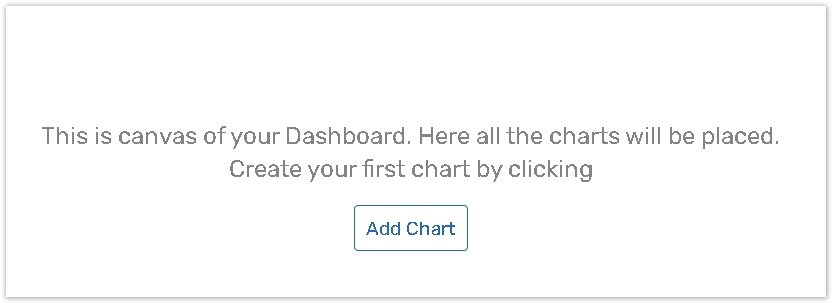
To create a new chart, click the +Add Chart button, located on the Dashboard Body area:
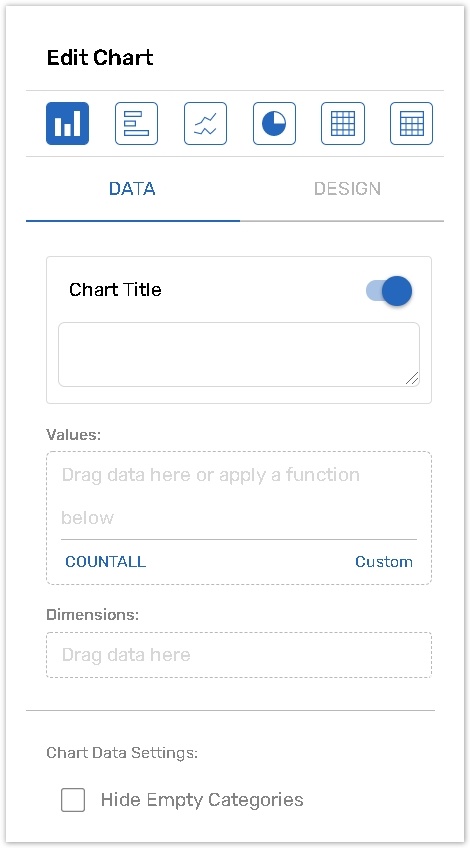
A blank chart appears on the Dashboard body and the Edit Chart panel opens on the right:
The current chapter contains the following topics
Article | Description |
|---|---|
The article explains how you can change charts' size, copy and delete them. The Edit Chart panel allows you to select a Chart Type, adjust its values and dimensions for building the chart, add/edit the chart title and subtitle. | |
A chart on the Dashboard is defined by values (calculated measurements based on the data collected in the form) and dimensions (a way to break down values by categories). | |
Dimensions are used to break down the calculated values into specific categories in a chart or table and help to focus on different groups of data. | |
The Design tab presents options depending on the Chart or Table type, as well as the combination of dimensions and calculations in the chart data. | |
| The chapter presents 5 chart types. |
The article explains how you can export charts either to CSV files or as JPEG, PNG or SVG image files. |