Chart Export
Charts from your dashboards can be exported either to CSV files or as JPEG, PNG or SVG image files;
This feature now allows you to share, publish and use in presentations any charts that contain data you have collected via our platform.
The Export button can be found on top of each chart in a dashboard; It may appear:
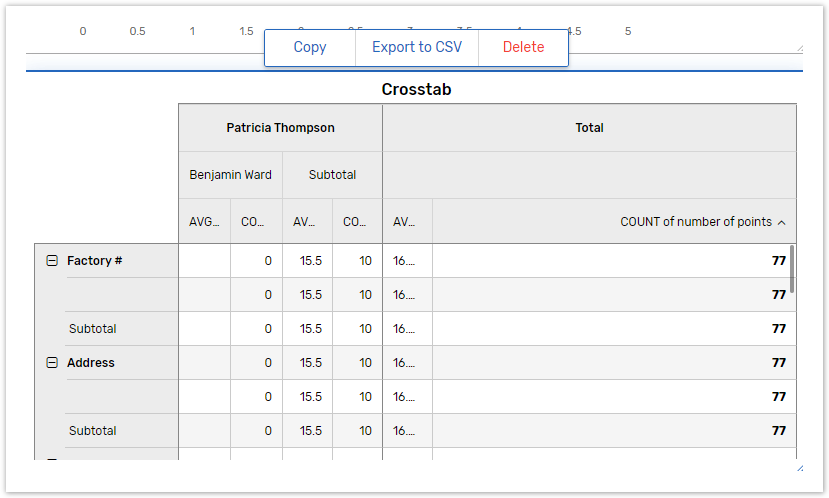
Either as Export to CSV:
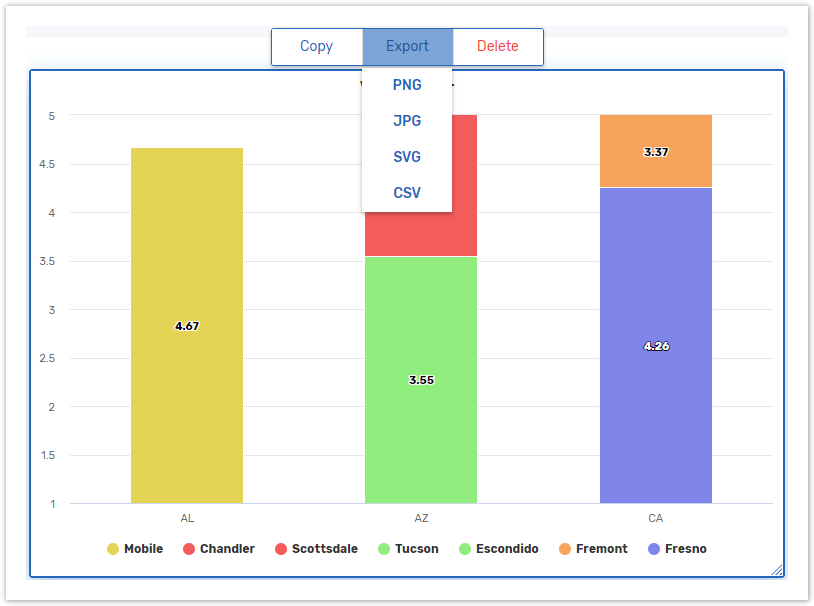
Or Export (the dropdown list with different export format file options will appear when you click the button):
Setting up Export
The exporting is available to and enabled only for the admins and dashboard creators in published public and private dashboards, as well as the dashboards that are not published.
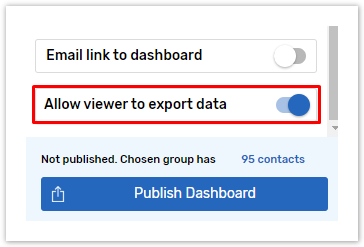
When publishing a dashboard to the Online Portal, you can also enable exporting for selected contacts:
click the Publish button in the right bottom corner of the Edit Dashboard panel.
Select Private access to the Dashboard and toggle on the Publish to Online user portal option.
Select the contact group that you intend to publish the dashboard for.
Toggle on Allow viewer to export data.
Publish the dashboard to the portal.
For more info on publishing for certain contacts or contact groups, see Publish Dashboard to the Online Portal
Exporting Settings
Bar charts, line charts and pie charts can be exported to CSV, as well as PNG, JPEG and SVG image formats.
Crosstabs and tables can only be exported to CSV.
The output file generated for exporting will have the same name as the exported chart; in case the chart has no name, the exported file will be named after the exported chart type: Vertical Bar, Crosstab etc.
Exporting to CSV
All types of charts are exported to CSV using comma as a delimiter.
When exporting RDT (raw data tables) to CSV, you will be offered two options to export a table header as either One line or Multi-line header:
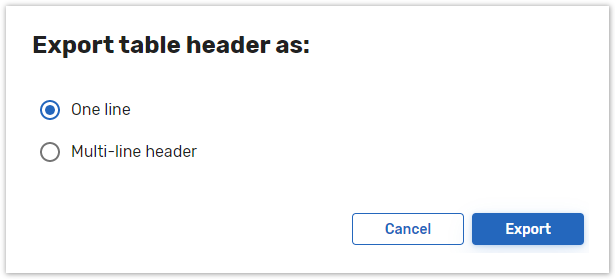
If the Multi-line header option is selected, up to three lines per row will be allocated for a header: the first line will contain a question's name, the second line will include an answer option name and the third line will include a column name where it is applicable.
Also, when multiple choice questions are exported, all answer options selected will be placed within a single cell, separated with a pipe character.
Filtering and Sorting in Exported Charts
If any data filters, group filters or user filters set by the viewer were applied to the dashboard, the filtered version of the data will be exported to CSV just as the filtered version of the chart will be exported to image formats.
The sorting of the data in the output file is done in accordance to the sorting applied in the chart dimensions' settings (except for the Tables, where the data is sorted chronologically).
For more info about Chart Dimensions and Dimensions sorting visit Chart Dimensions.