Editing Charts
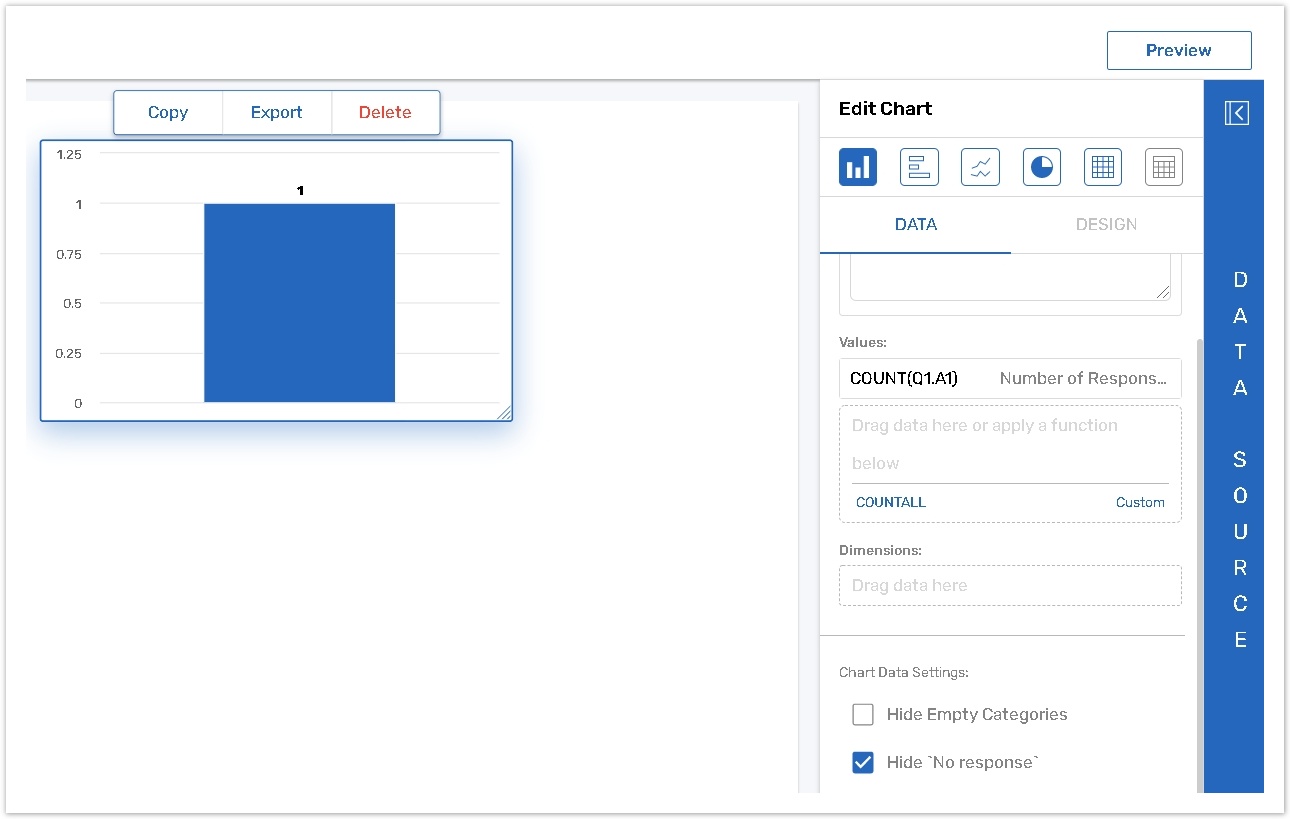
On the Edit Dashboard page, you can change charts' size, copy and delete them. The Edit Chart panel allows you to select a Chart Type, adjust its values and dimensions for building the chart, add/edit the chart title and subtitle.
Click on a chart to activate the Edit Chart panel.
Dashboards body area
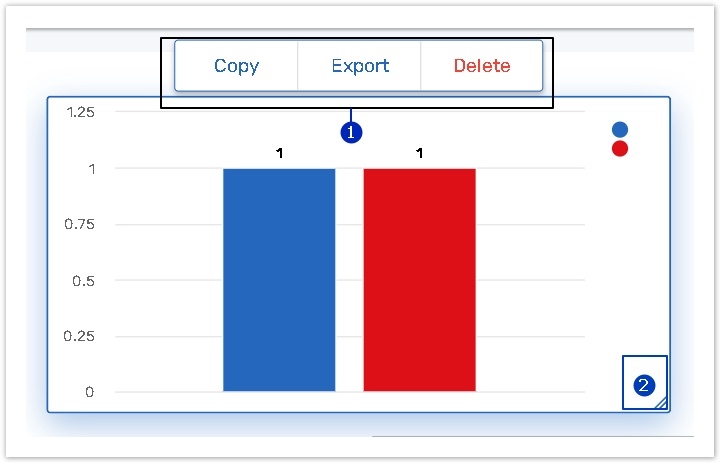
Click on a chart to:
Drag and drop charts to reorder them on the page;
Copy/Export/Delete a Chart;
Resize the chart, select its bottom right corner, and move the mouse to make it smaller/bigger.
You can export a chart to the following formats:
.png?inst-v=5c056e1e-ae23-46ea-99ee-f3d1279e23b0)
The Edit Chart panel
Tap on a Chart to activate the Edit Chart panel.
The Edit Chart panel consists of 3 major parts:
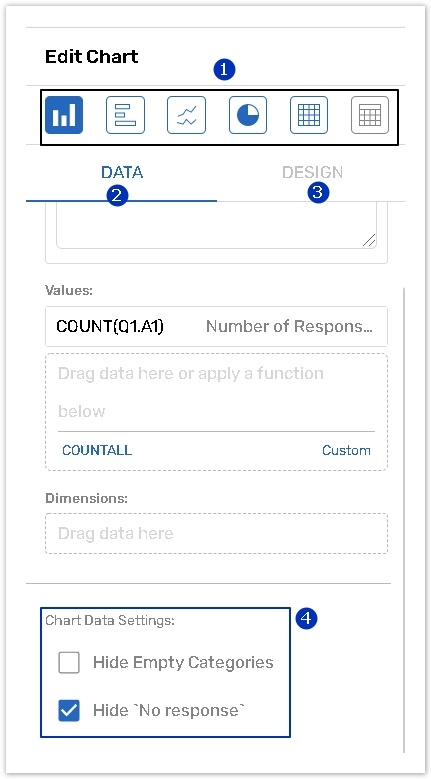
1.The icons with types of charts allows you to choose a chart type or switch to a different one by clicking these icons.
More information can be found in the Chart Types chapter.
On the
Data tab, you may specify the Chart Title, Chart Values (Calculations), Chart Dimensions,
On the
Design tab, you may set up a Chart Title, as well as activate/deactivate multiple chart design options which influence how the chart is displayed. More information can be found in the Chart Design chapter;
The Data tab also displays
Hide Empty Categories or 'No response' categories if needed.
The Chart Title is limited to 150 characters including spaces.
Chart Values and Dimensions
You can indicate which data should be used to build a chart by dragging it from the Data Source panel to Values and Dimensions fields.
Values (Calculations) are calculated measurements of data collected in certain questions, answer options or columns of your form. Values display your numeric data in charts or tables. The examples of values are a number of responses, scores, calculated averages of numeric values.
Dimensions break down Values into categories on a chart or table. They help to focus on different groups of data, for instance, different regions, names, types, facilities, etc.
Although each chart type has its own names and limits for values and dimensions (show by, slices, rows, columns), there are some general rules that apply to all of them:
To create a chart, drag and drop the question or its part from the Data Source panel to the Value or Dimension field. The compatible questions are indicated with the following symbol:
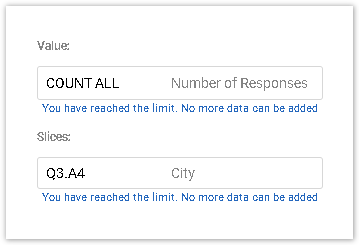
If the Chart type supports multiple Values/Dimensions, you may add several questions or their parts until the limit is reached. In such case, the following notification message will be displayed:
3. The Section Header and Compare One Against Another question types are not supported and cannot be used to build a chart;
4. You may rearrange the data in values/dimensions by dragging; the charts will be updated on the Dashboard Body automatically.
5. You may also drag data from values to dimensions, and vice versa.
Dragging from the Data Source Panel
To set up a chart you need to drag the questions, their elements, or system fields from the Data Source panel to a corresponding field on the Edit Chart or Edit Filter panel. Please refer to the screenshot below:
Chart Data Settings
There are 2 Settings of the Chart Data:
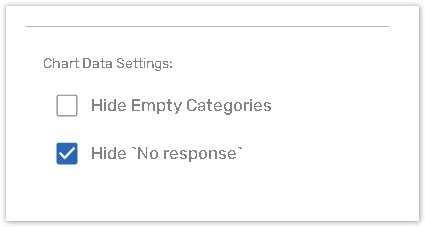
Hide Empty Categories
The setting is common for all chart types, except for Table. If you want to hide the dimensions (or table rows/columns) for which there are no responses, you can enable this setting:
ℹ️ For example:
In your form, you ask a respondent to choose their Gender (1st question) and Department (2nd question):
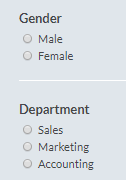
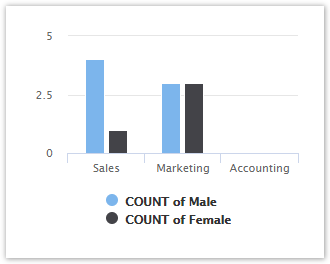
Then you would like to see how many males and females are in different departments, so you create a Bar Chart in your Dashboard and add Male and Female answer options as Values, and Department question as Dimensions (Show by).
If none of the respondents selected the Accounting department, the Accounting bar will be empty:
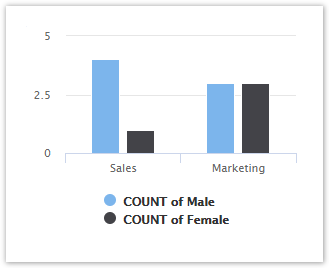
You can hide this bar by enabling Hide Empty Categories on the Edit Chart panel:
Hide 'No Response'
The setting is on by default. It hides No Response category in Charts. It might appear if respondent answered a question added as a Chart Value, but did not provide a response to the question, used as a dimension.
Once you have edited the Chart, click the <Dashboard link on the top of the Edit Chart panel, or click anywhere on the canvas outside charts. This will return you to the Edit Dashboard panel.
To stop editing one chart and start editing another, simply select a different chart on the Dashboard body.
Chart Design Settings
Design tab is located on the Edit Chart panel. You may access it while creating or editing one of your Charts. The Design options that are available there depend on the Chart or Table type, as well as the combination of dimensions and calculations in the chart data.
Chart Design settings override Dashboard Design settings. Read the article for more information.