Chart Values (Calculations)
A chart on the Dashboard is defined by values (calculated measurements based on the data collected in the form) and dimensions (a way to break down values by categories).
Depending on the data format, different set of formulas and settings are available for calculating values and setting up dimensions.
Values are calculations represented in charts. The values appear on the y-axis and in crosstab cells and affect the height of bars in bar charts, size of a slice in a pie chart, etc.
To set up Values, drag and drop the whole question or its part from the Data Source panel to the field Values on the Edit Chart panel:
.png?inst-v=5c056e1e-ae23-46ea-99ee-f3d1279e23b0)
Once data is placed into Values, a formula will be applied to it to calculate the aggregate measure. Depending on the data format, you will be offered a different set of formulas that you can choose instead of the default one.
Please refer to Functions in Values section for more information.
Values Settings
Once the value is added, you may hover over it to adjust its Settings or Delete it:
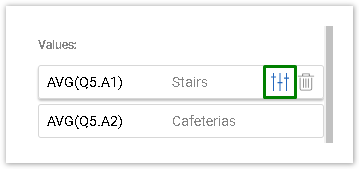
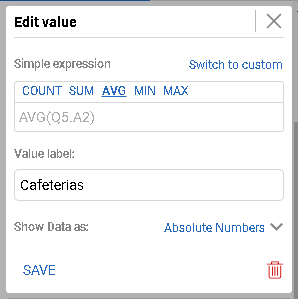
Click the Settings icon to edit the value: you may change the function, edit a Value Label, or choose how to Show Data: as Absolute Numbers or Percent.
The Percent of the total value will be calculated for each dimension category in a chart or a table.
The chart type Crosstab has more data view options than the rest of the charts. For more information, visit the Help Chapter on Crosstabs.
At least one value is required to build a chart.
All Chart types except the Pie Chart can have more than one value.
Use drag and drop to reorder the values on a chart.
Functions in Values
Standard functions
Standard functions – A set of functions provided by our system that perform certain calculations. The question or its part referenced in the function is displayed in parentheses, e.g. COUNT(Q6), AVG(Q3.C1) etc.
Each type of function can be applied only to specific data formats and thus may not be available for certain question/answer types. Once the data source is selected for a value, only compatible functions will be displayed.
Here is a list of available functions:
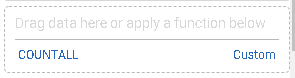
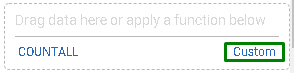
COUNT ALL - This function can be used if no value is provided. It outputs the total number of respondent records for the form/survey. This is a special function as it does not require a question or answer option to perform a calculation, unlike all other functions. It is always available under a blank value field:
COUNT - Outputs the number of respondent records for the question/answer/column that is added as a value.
SUM - Used to calculate the sum of all numeric values in the specified question or field. These would be either respondent-entered numeric values or values assigned to predefined answer options via Branch on Range logic.
Our system converts all expressions to zero if any of its parts have an empty (NULL, not 0) value.
The result of summarizing in such case will be 0, and no data is displayed on the Dashboard.
AVG - Calculates the average of all numeric values in the specified question or field.
AVG calculation may be described the following way:
AVG(Q1) = SUM(Q1) / size (Q1),
Where size (Q1) would equal the number of answers given for the selected data source.
MIN - This function returns the minimum value for the selected Data Source.
MAX - This function returns the maximum value for the selected Data Source.
ℹ️ For Example:
You have a Single Line field in your form with the numeric format applied which records how old your respondents are. You have collected 3 responses: 23, 26, and 35. The output of the functions will be as follows:
COUNT: 3 (number of responses)
SUM: 84
AVG: 28
MIN: 23
MAX: 35
Custom expressions
Custom expressions - A mathematical operation that uses standard functions (e.g., AVG(Qx.Ay)) or static numbers as its operands and a number of arithmetic expressions as its operators. If you need to perform calculations of scores, percentages combining data from different questions or answer options, you may input a custom expression.
For example, a custom expression may look like this:
(COUNT(Q3.A1)+AVG(Q3.A5))/MIN(Q5)*12
To add a custom expression, create a new Chart and choose Custom in the values section:
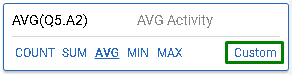
You may also build it based on a standard function. To do it, add a value to the Chart from the Data Source panel and switch to expression:
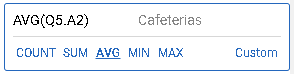
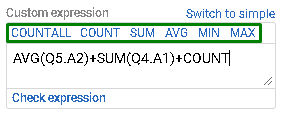
Once you are writing a custom expression, you may click on the functions above to insert them into your expression:
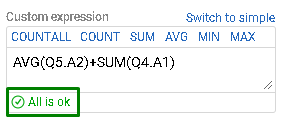
Click Check expression to validate it. You will see the status at the bottom:
In the example below the number of question after COUNT function is missing, which triggered the error message:
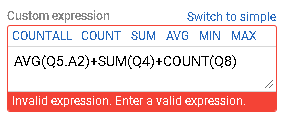
You can save the invalid expression anyway as you may want to edit or correct it later. However, it will not be calculated until fixed.
Custom expressions may consist of:
Operands |
|
Operators |
|
Parentheses | Parentheses can be used to create complex operands by embracing certain expressions, e.g. (SUM(Q3.A1+Q5.A9-100)+100)+COUNT(Q56) or to specify order of operations |
The input field of custom expression is limited to 1024 characters.
While working with functions in values, you may switch from simple to custom mode using the Switch to simple/custom option and vice versa before you save the expression.
In custom expressions, you need to use that question reference which has only one numeric value, not an array or values. This is applicable for any math operation and aggregation, except for the Count function.
For example, if you need to refer to a Pick One or Other question, you may use Qx reference, as this question allows only one selection.
For a Single line text, you need to use Qx.Ay reference, to specify the exact row with the value.
For Matrix and Rating scale question types, you may use Qx.Ay.Cz reference. Object Lookups, Multiline questions can be referenced either by Qx or Qx.Ay.
Calculations by Question Type
Here is detailed information on which functions in Calculations are available for different question types and their fields.
Static Text
COUNT | SUM | AVG | MIN | MAX | |
Qx | - | - | - | - | - |
Pick one (radio buttons)
COUNT | SUM | AVG | MIN | MAX | |
Qx | + | + | + (default) | + | + |
Qx.Ay | + | + (default) | + | + | + |
Qx.Ay(Other) | + (default) | - | - | - | - |
Pick one with ‘comment’
COUNT | SUM | AVG | MIN | MAX | |
Qx | + | + | + (default) | + | + |
Qx.Ay | + | + (default) | + | + | + |
Qx.Ay(Comment) | + (default) | - | - | - | - |
Check all that apply
COUNT | SUM | AVG | MIN | MAX | |
Qx | + | + | + (default) | + | + |
Qx.Ay | + | + (default) | + | + | + |
Qx.Ay(Other) | + (default) | - | - | - | - |
Dropdown box
COUNT | SUM | AVG | MIN | MAX | |
Qx | + | + | + (default) | + | + |
Qx.Ay | + | + (default) | + | + | + |
List box
COUNT | SUM | AVG | MIN | MAX | |
Qx | + | + | + (default) | + | + |
Qx.Ay | + | + (default) | + | + | + |
Single Line Text
COUNT | SUM | AVG | MIN | MAX | |
Qx | + (default) | - | - | - | - |
Qx.Ay (general) | + (default) | - | - | - | - |
Qx.Ay (currency) | + | + | + (default) | + | + |
Qx.Ay (date) | + (default) | - | - | - | - |
Qx.Ay (decimal) | + | + | + (default) | + | + |
Qx.Ay (number>0) | + | + | + (default) | + | + |
Qx.Ay (number>=0) | + | + | + (default) | + | + |
Qx.Ay(percent) | + | + | + (default) | + | + |
Qx.Ay (email) | + (default) | - | - | - | - |
Qx.Ay (Social Security Number) | + (default) | - | - | - | - |
Qx.Ay (zip code) | + (default) | - | - | - | - |
Qx.Ay (custom TEXT format) | + (default) | - | - | - | - |
Qx.Ay (custom NUMBER format) | + | + | + (default) | + | + |
Multi-Line Text
COUNT | SUM | AVG | MIN | MAX | |
Qx | + (default) | - | - | - | - |
Qx.Ay | - | - | - | - | - |
Rating scale
COUNT | SUM | AVG | MIN | MAX | |
Qx | + (default) | + | + | + | + |
Qx.Ay | + | + | + (default) | + | + |
Qx.Ay.Cz | + | + (default) | + | + | + |
Qx.Cz | + | + (default) | + | + | + |
Matrix
With Pick One Column:
COUNT | SUM | AVG | MIN | MAX | |
Qx | + (default) | - | - | - | - |
Qx.Ay | + | + | + (default) | + | + |
Qx.Ay.Cz (text) | + (default) | - | - | - | - |
Qx.Ay.Cz (numeric) | + | + | + (default) | + | + |
Qx.Ay.Cz (Pick one) | + | + (default) | + | + | + |
Qx.Ay.Cz (Check all) | + | + (default) | + | + | + |
Qx.Ay.Cz (Dropdown) | + | + (default) | + | + | + |
Qx.Cz (text) | + (default) | - | - | - | - |
Qx.Cz (numeric) | + (default) | - | - | - | - |
Qx.Cz (Pick one) | + | + (default) | + | + | + |
Qx.Cz (Check all) | + | + (default) | + | + | + |
Qx.Cz (Dropdown) | + | + (default) | + | + | + |
Without Pick One Column:
COUNT | SUM | AVG | MIN | MAX | |
Qx | + (default) | - | - | - | - |
Qx.Ay | + (default) | - | - | - | - |
Qx.Ay.Cz (text) | + (default) | - | - | - | - |
Qx.Ay.Cz (numeric) | + | + | + (default) | + | + |
Qx.Ay.Cz (Check all) | + | + (default) | + | + | + |
Qx.Ay.Cz (Dropdown) | + | + (default) | + | + | + |
Qx.Cz (text) | + (default) | - | - | - | - |
Qx.Cz (numeric) | + (default) | - | - | - | - |
Qx.Cz (Check all) | + | + (default) | + | + | + |
Qx.Cz (Dropdown) | + | + (default) | + | + | + |
Numeric Allocation
COUNT | SUM | AVG | MIN | MAX | |
Qx | + (default) | - | - | - | - |
Qx.Ay | + | + (default) | + | + | + |
Qx.Ay(Total) | + | + (default) | + | + | + |
Object Lookup
COUNT | SUM | AVG | MIN | MAX | |
Qx | + (default) | - | - | - | - |
Qx.Ay | + (default) | - | - | - | - |
Multiple Object Lookup
COUNT | SUM | AVG | MIN | MAX | |
Qx | + (default) | - | - | - | - |
Qx.Ay | - | - | - | - | - |
File Upload
COUNT | SUM | AVG | MIN | MAX | |
Qx | + (default) | - | - | - | - |
Qx.Ay | + (default) | - | - | - | - |
How Numeric Values are Calculated
Numeric values whether assigned to predefined answer options or entered by the respondent in the open-ended questions are used in mathematical and statistical calculations such as SUM and AVG.
Numeric values for predefined answer options (in Pick one, Check all, Dropdown, List box question types) can be added on the Branch on Range logic page. It can be accessed by clicking the Logic button next to the question on the Form/Survey Edit page.
If custom numeric values are not provided the defaults assigned by the system will be used. The default value is the sequence number of the answer option or the column.
For Rating scale and Matrix questions, numeric values are assigned only to Pick one, Check all and Dropdown column types. The numeric value assigned to the column is also its sequence number.
If the column within the 3D Matrix is formatted as Dropdown, then a numeric value from 1 to n (number of options) will be assigned to each option in it.
Question (Qx)
Applies to | Returns |
Pick One, Check All, Dropdown, List Box | A numeric value for every radio button and every checkbox selected by each respondent, where the numeric value is assigned to the answer option. If a respondent has selected more than one checkbox, all of their values will be returned as a result |
Rate different items along the scale of your choice, Pick OneColumns in 3D Matrix | The numeric value of every column selected by the respondent |
Answer option (Qx.Ay) - Applies to both predefined options and open-ended fields (if they are answered with a numeric value).
Applies to | Returns |
Pick one, Check All, Dropdown, List Box | 1 (or other numeric value that is assigned to the selected answer) is returned for each respondent who has selected a particular answer option |
Single line question with numeric format Object Lookup fields with numeric format Numeric Allocation | A numeric value entered by the respondent |
Rate different items along the scale of your choice, Pick One columns in 3D Matrix | A numeric value corresponding to the selected column |
A numeric value on the answer level (Qx.Ay) does not apply to 3D Matrix questions without 'Pick One' columns.
Column (Qx.Cz)
Applies to | Returns |
Rate different items along the scale of your choice, | A numeric value for the selected column corresponding to its sequence number. |
Dropdown columns in Matrix | A numeric value for the selected option in the dropdown column |
If a Matrix question does not have any of the columns listed above, the SUM and AVG functions will not be available.
Field (Qx.Ay.Cz)
Applies to | Returns |
Rate different items along the scale of your choice, | A value entered by the respondent into the numeric field, or a numeric value that corresponds to the selected option in a Dropdown, Pick one, Check all columns. |
NULL values
Some answer options or columns may have a NULL value assigned to them, such as when a value is not provided for an answer option on the Branch on Rangepage. Null values will be excluded from the numeric calculations, but not from COUNT function. These values are skipped when the AVG and SUM functions are used.
Displaying Values
You can change the way values are displayed on your chart, making it easier to compare values either to one another or to calculated totals in a chart.
This can be done in charts of all types, except Tables.
Add some data from the form and go to the Edit value / Settings screen to set up the formulas needed to calculate the values.
When done, use the Show Data as dropdown list to change the display option.
For chart types (other than Crosstabs), three metric display options are available:
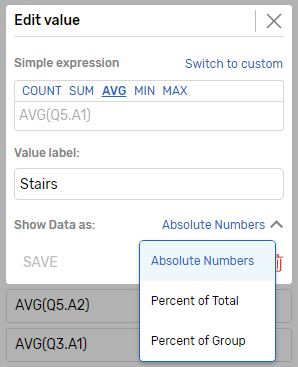
Absolute Numbers: Shows values created from acquired data using their original metric.
Percent of Total: Displays total values in each dimension as percentages from the total sum of values in the chart which constitutes the 100%.
Use Percent of Total to compare each value to the total sum of values in the chart.
Percent of Group: Displays each value as the percentage it constitutes in a single dimension category (assuming that each dimension is the 100%).
Use Percent of Group to see how values within each dimensional category compare or relate to one another.
For more information on calculating Percent of Subtotal in Crosstabs, visit Crosstab Help page.