Crosstab
This type of chart displays data in a pivot table. You may specify both row and column dimensions and unlimited values, as well as display totals and subtotals.
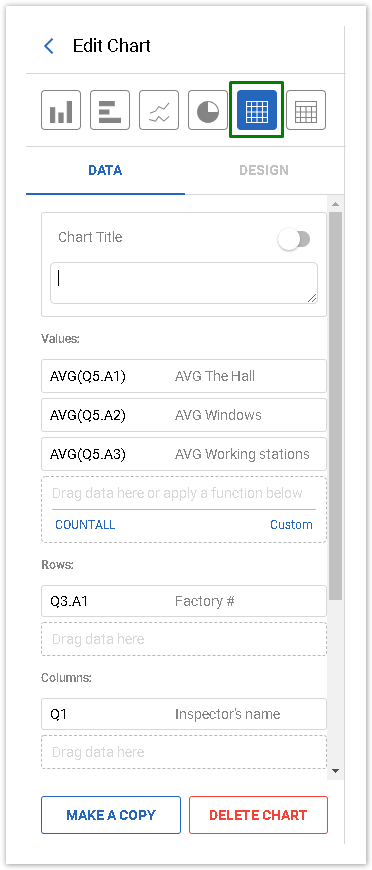
To create a Crosstab chart, add values and dimensions from the Data Source tab by dragging and dropping them to the corresponding fields of the Edit Chart Panel. For Crosstabs, calculations are named Values, and dimensions are called Rows and Columns:
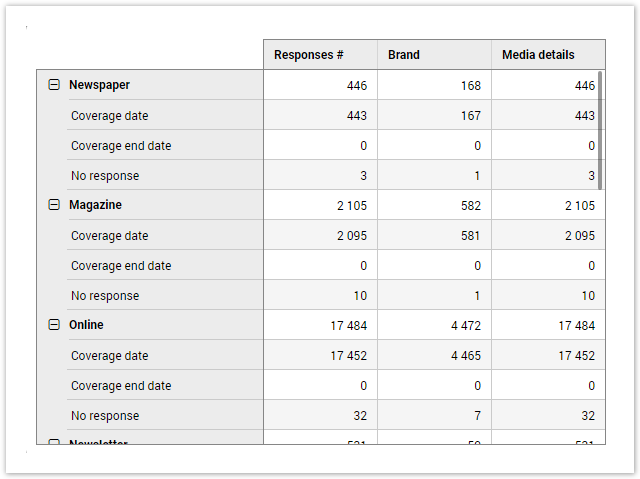
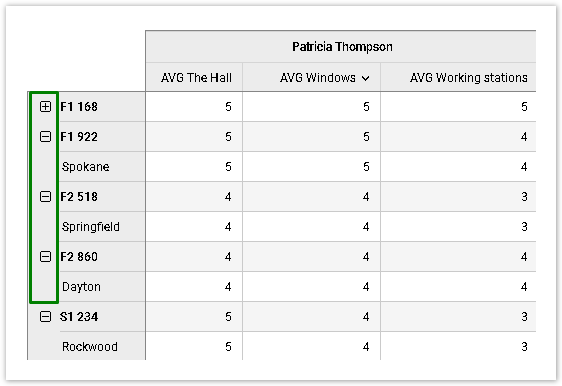
If multiple dimensions (rows and columns) are added, they will be grouped. Multiple dimensions in columns will be displayed as sub-columns, and multiple dimensions in rows will be displayed as a tree. The first dimension will become the parent element (in bold), which you will be able to collapse/expand to show or hide sub-rows:
You can sort data in the crosstab by clicking one of the Column Headers/Subheaders. The second click reverses the sort order. To resize the column, drag its right border to the right or left.
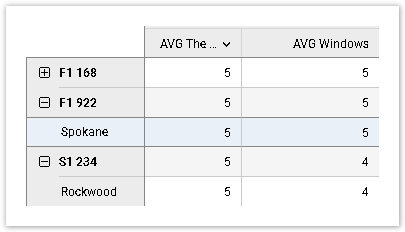
When one of the rows is selected, it becomes highlighted in blue:
If the crosstab does not fit into the size of its widget, scroll bars appear to allow scrolling horizontally and vertically.
Totals and Subtotals
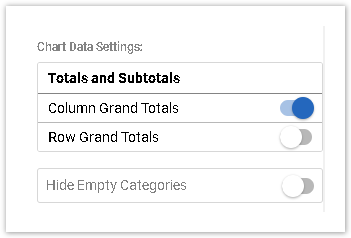
Once one Row and one Column is added, the option to display Totals becomes available in Chart Data Settings with the Column Grand Totals option turned ON by default:
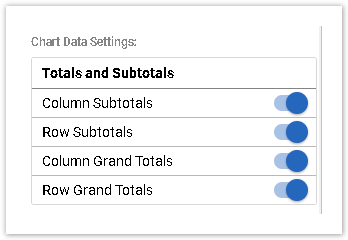
If multiple rows/columns are added, Subtotals become available:
Column subtotals are displayed as the last sub-column, and row subtotals as the last row for all sub-rows. This means that when sub-rows are collapsed, subtotals will not be displayed.
Subtotals are displayed as the last column or row in a group. If you choose to collapse a group of rows, the rows along with the rows subtotals will not be displayed.
If one of the values that should be counted is empty, it influences the result. So, the Crosstab cell will be empty.
Data Display Options
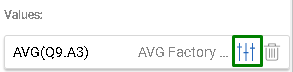
You may edit the Values in the Crosstab and change how the data is displayed:
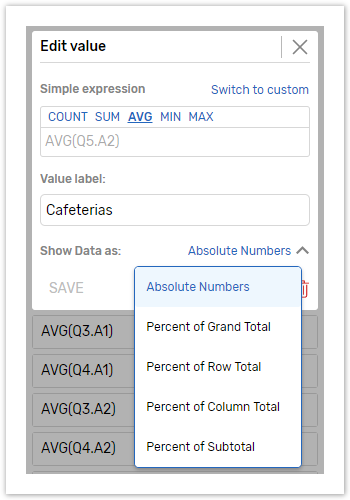
The following options are available for the Crosstab chart:
Absolute Numbers - Data is shown as absolute numbers.
Percent of Grand Total - The percentage of each value in a table (each cell) is calculated against the grand total (bottom right cell of the table, which is displayed when Rows and Columns totals are ON).
Here is an example of how grand total is calculated:
Value: AVG(Q12.A7), Dimension: Q3. Grand total will be the average of Q12.A7 for all respondents who provided at least one answer to Q3;
Value: AVG(Q12.A7), Dimension: Q3, Q17.A8. Grand total will be the average of Q12.A7 for all respondents who provided at least one answer to Q3 and Q17.A8
Percent of Row Total - The percentage of each value in a row is calculated against the row total for that row.
Percent of Column Total - The percentage of each value in a column is calculated against the column total for that column.
Percent of Subtotal – The percentage of each value calculated against the percent of Row Total and Column total average.
Values and Dimensions Settings
The Crosstab Chart a maximum number of data points is limited to 400 000 unique values.
Crosstabs can be configured in the following ways:
Number of | Number of | Number of | Result | Crosstab Example |
1 or multiple | 0 | 0 | Values appear as table rows, and the table has two columns: |  |
1 or multiple | 0 | 1 or multiple | Values appear as table rows, and dimensions as table columns. |  |
1 | 1 or multiple | 1 or multiple | Data added as rows and columns appear accordingly. |  |
more than 1 | 1 or multiple | 1 or multiple | Data added as rows and columns appear accordingly. |  |
A Crosstab table may have a title and a subtitle, which can be added on the Data and Design tabs of the Edit Chart panel.
There is a total limit of 400,000 cells or 4000 columns for the whole table. If a crosstab with more cells or columns is configured, the corresponding error message will be displayed.