Data Source Panel
The collapsed Data Source panel is located on the right panel. It displays questions, answer options, columns and some system information associated with the form that you’ve selected as a data source for your Dashboard. This data is used to set up charts and filters.
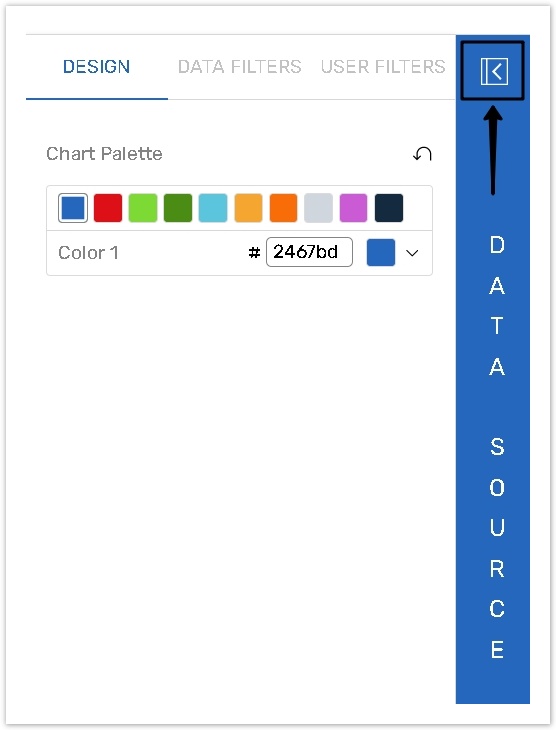
The Data Source panel consists of System Fields and Task Properties and List of questions.
The article describes features and adjustments of the parts and how to use them to set up charts and filters.
System Fields
It is a list of form special fields, such as Submit Date, Response ID, Response Status, Email, etc.
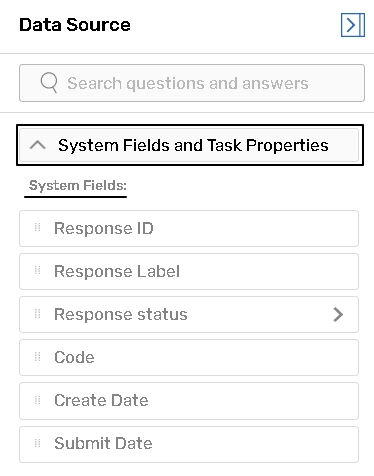 | Response ID - Response ID assigned by the system to each individual respondent. It can be saved into one of the form fields with the help of the Respondent ID Saver plugin. Response Label - Response Label generated for respondent per formula on the form/survey Settings page. Response Status - Status of the Responses can either be In Progress (respondent has not finished to fill out the form) or Completed (a respondent has completed a form and pressed the Submit button). Code - The password or unique code assigned to the respondent when the form is launched via Password protection method, or the respondent email address for the forms launched via email Create Date - Date and time when the respondent record was created. Submit Date - Date and time when the respondent record was submitted. |
|---|
Task Properties
If your form is attached to the Task Definition, a list of Task Properties will appear on the Data Source tab. These Task Properties can also be used to set up charts and filters.
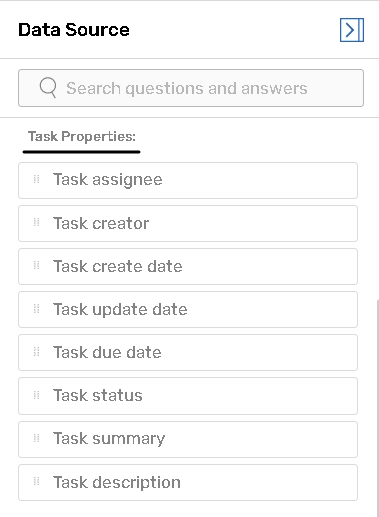 | Task assignee - The contact, to whom the task was assigned. Task creator - The contact, who created the task. Task create date - The date when the task was created. Task update date - The date when the task was updated. Task due date - The date when the task is due. Task status - The task status label. Task summary - The name of the task. Task description - The description of the task. |
|---|
COUNT is the only function that can be applied when Task Properties are used as Chart Values.
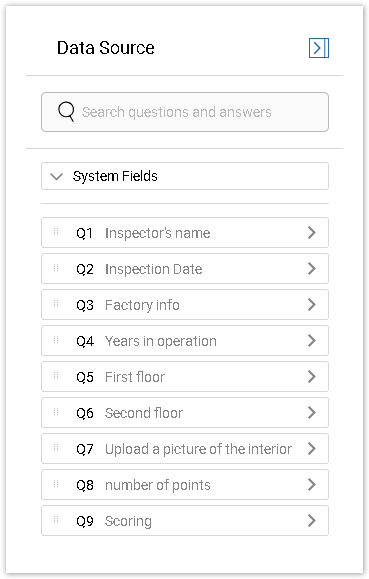
List of Form Questions
Questions, answer options and columns present in the selected form that may be added to Charts and Filters.
The questions on the Data Source panel appear in the same order as in the form. You can add an answer option, column or cell to the chart without adding the whole question. To do so, click the question to expand the list and then select the desired item.
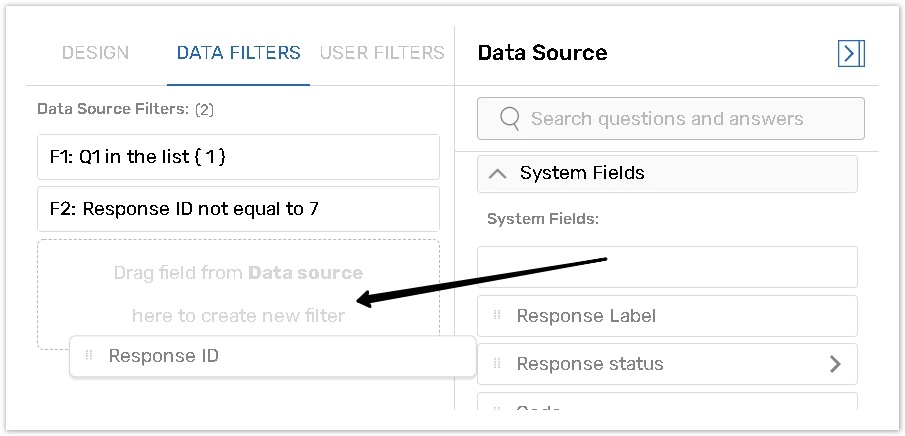
Dragging from the Data Source Panel
To set up a chart or filter, you need to drag the questions, their elements, or system fields from the Data Source panel to a corresponding field on the Edit Chart or Edit Filter panel.
Please read the corresponding articles for more information about the Editing Charts and Dashboard Filters.