Bar Chart
This type of chart displays numeric data with bars. Each bar represents a dimension point, and the height or length represents a value.
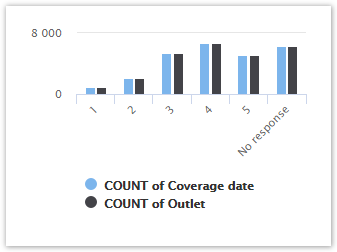
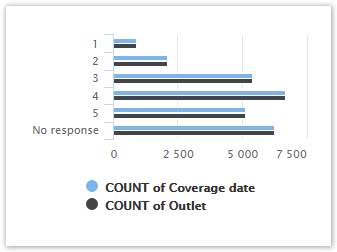
Bar Charts can be Vertical and Horizontal.
Vertical
Horizontal
The Vertical Bar chart is the default type.
Both Bar Chart types have the same settings and limitations, so you may switch to horizontal view and back at any time.
To create a Bar chart, add values and dimensions from the Data Source tab by dragging and dropping them to the corresponding fields of the Edit Chart Panel.
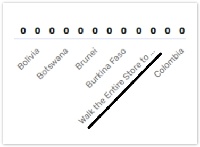
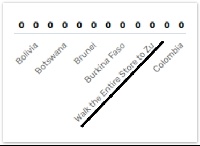
Labels under the bar graph can be displayed fully or cropped, depending on the lengths of a string.
.png?inst-v=5c056e1e-ae23-46ea-99ee-f3d1279e23b0)
Values and Dimensions Settings
The Bar Chart supports the following combinations of Values and Dimensions (Show by):
Number of | Number of | Result | Vertical Bar Chart Example |
1 | 0 | One bar representing the calculated value |  |
multiple | 0 | One bar for each value, with the size representing |  |
1 | 1 | One bar for every dimension point; |  |
multiple | 1 | A Grouped bar chart, with a separate column for |  |
1 | 2 | A Stacked bar chart. The first dimension represents separate bars, |  |
The Bar Chart a maximum number of data points is limited to 10 000 unique values.
This chart type is limited to either multiple values with one dimension or 1 value with 2 dimensions.
When setting up Values, you may choose to show data as absolute numbers or as percentages:
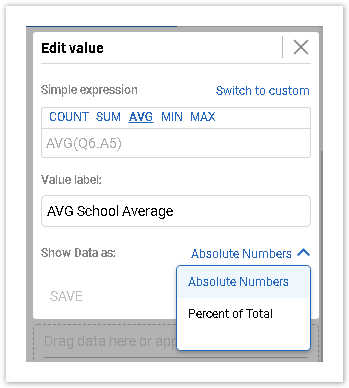
Grouped bar charts will display the percent for each bar relative to the group.
Stacked bar charts will display the percent for each stack within one bar.