Pie Chart
This type of chart presents data in a pie, with separate slices for each dimension point. The size of the pie slice represents the value.
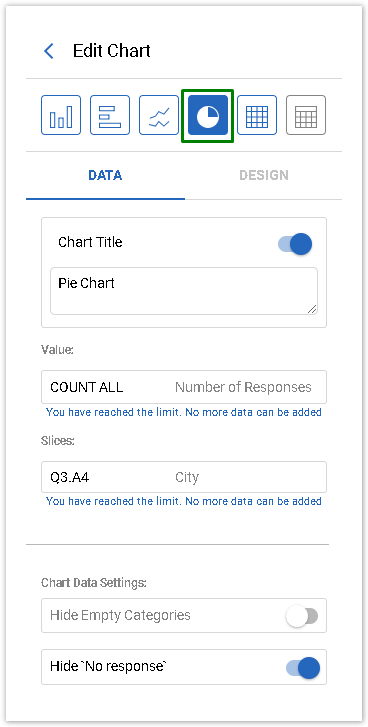
To create a Pie chart, add a value and dimension from the Data Source tab by dragging and dropping them to the corresponding fields of the Edit Chart Panel. For Pie Charts, calculations are named Values, and dimensions are called Slices:
Value and Dimension Settings
The Pie Chart a maximum number of data points is limited to 1000 unique values.
The Pie Chart is limited to 1 dimension and 1 value
Pie charts may be configured in the following ways:
Number of | Number of | Result | Pie Chart Example |
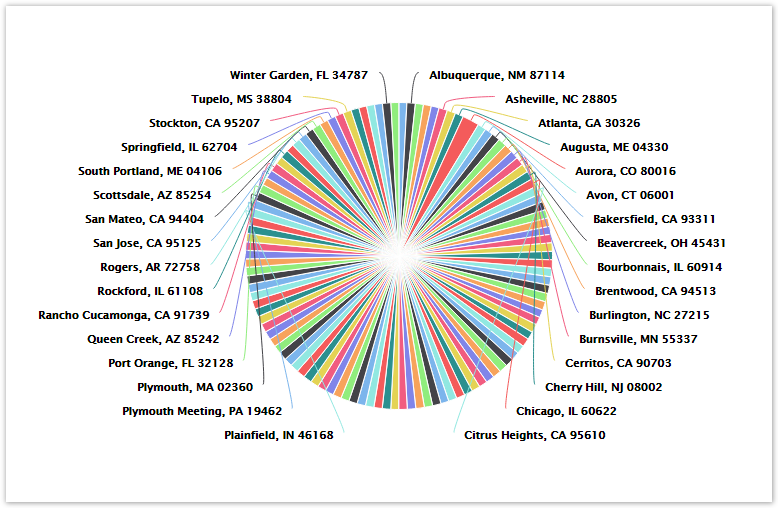
1 | 0 | A circle with no slices is displayed, representing the calculated value |  |
1 | 1 | A slice of the pie is generated for every dimension point, dividing the sum of all values proportionally per every dimension point. |  |