Table
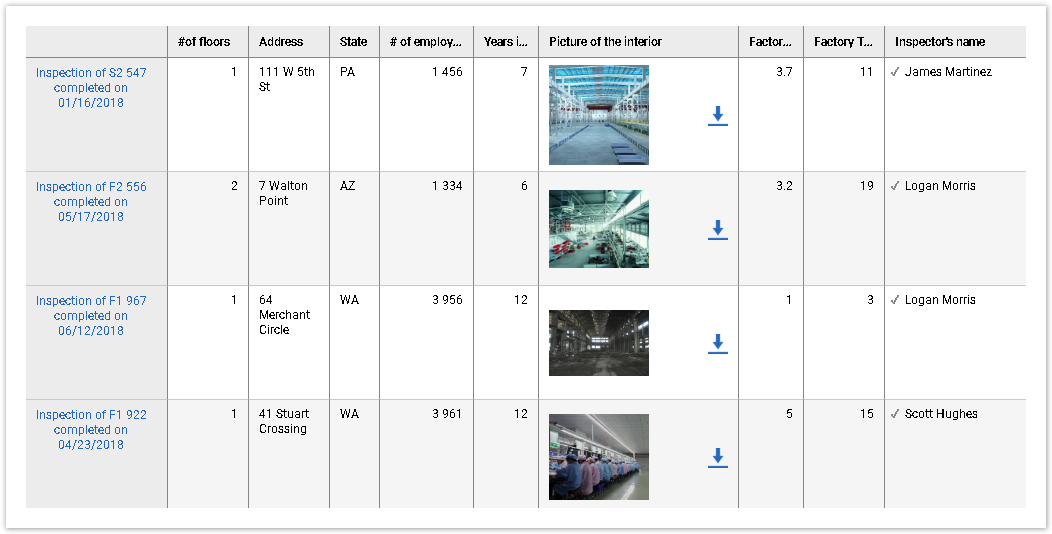
This type of chart displays raw data in a table. You may create multiple columns and enable links to Reports by Respondent.
To create a Table, drag data from the Data Source to the Column fields of the Edit Chart Panel:
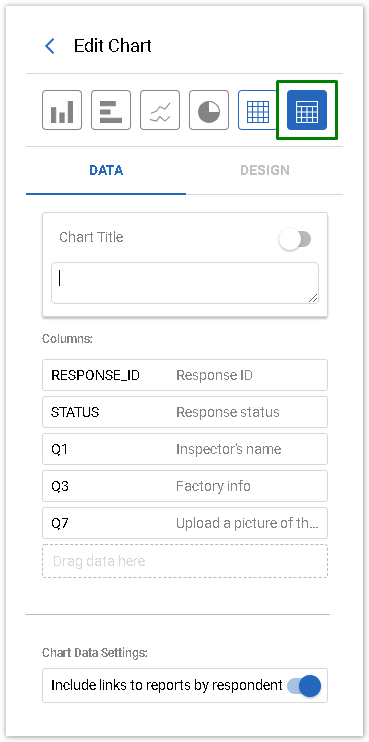
Data Tab | Design Tab |
Tables have only columns; Values cannot be added to the table. Each row represents an individual response. System Fields including Task Properties, questions and their parts can be used to create columns. If you are using Internal Notes in your form, they can also be added to the table.  If this option is enabled, the links will be presented in the first column of the Table. If you have set up a Response Label on the Settings page of your form, hyperlinked response labels will be shown. If not, View links will be displayed. | On the Design Tab of the Table Chart you may enable and specify a Chart Title and Subtitle, and choose the number of responses to be displayed per page: |
You can sort data in a Table by clicking on the Column Headers. The second click reverses the sort order. To resize the column, drag its right border to the right or left.
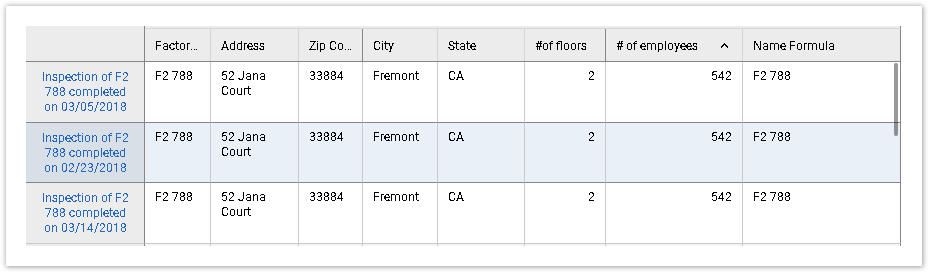
When one of the rows is selected, it becomes highlighted in blue:
If a Table does not fit into the size of its widget, scroll bars appear to allow scrolling horizontally and vertically.
A Table is limited to 500 columns.
Links to RBRs are not displayed to viewers of Public Dashboards.