
The Time Series feature displays the response statistics within a set period of time and breaking it into the intervals defined by the user.
For example, you can learn about the consumption rates of 2 similar products within a time period using the stats.
The Time Series feature is available only for the following question types:
-
Pick One with Comment;
-
Pick One or Other;
-
Check All that Apply;
-
Dropdown List;
-
List Box;
-
Rate Different Items;
-
Numeric Allocation;
-
Single line text with pre-format options (with the Numeric format).
The article describes how to implement and adjust the feature.
How to implement the Time Series feature
-
On the Report Items page click the Edit button;

-
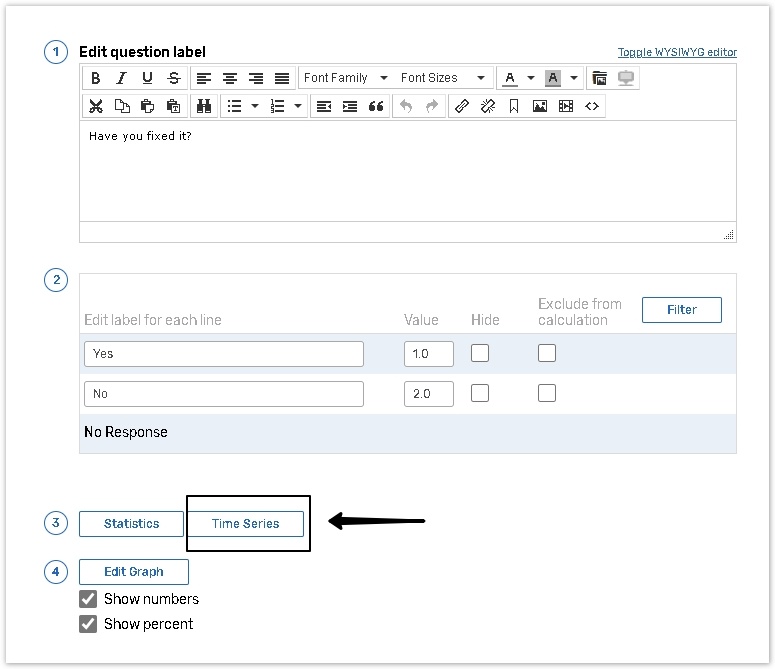
On the Edit page click the Time Series button;
How to adjust the feature
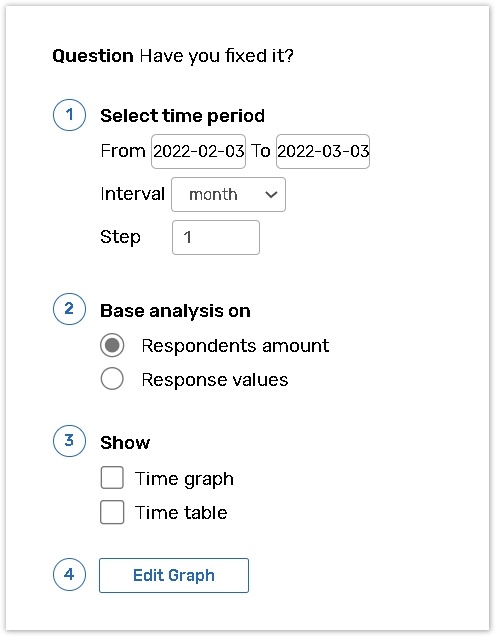
Adjust the following parameters on the Time Series page.
|
|
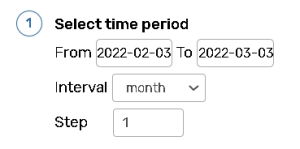
Define the time period you want to view the response statistics (to a particular question) using the From and To calendar menus. Make sure your 'To' date is not before your 'From' date. Use the Interval dropdown menu to break down time periods into years, quarters, months, weeks and days. The overall length of an interval should be shorter than the whole time period selected. Use the Step text box to set the interval pacing. For example, if you chose a time period of 1 month, an interval of a week and your interval step is '2', then you will have two intervals, each interval is 2 weeks long. |
|---|---|
|
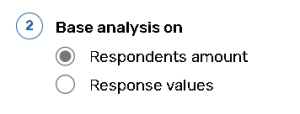
Select the Respondents amount option to design tables and graphs according to the total number of respondents for each answer option in a question. Select the Response values radio button to design tables or graphs according to the values assigned to the responses multiplied by the total number of respondents for each answer option in a question. |
|
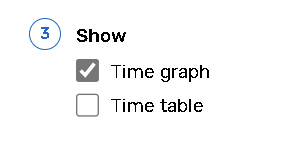
Select Time graph to display the time series graph in your report. Select Time table to display the time series data as a table in your report. |
-
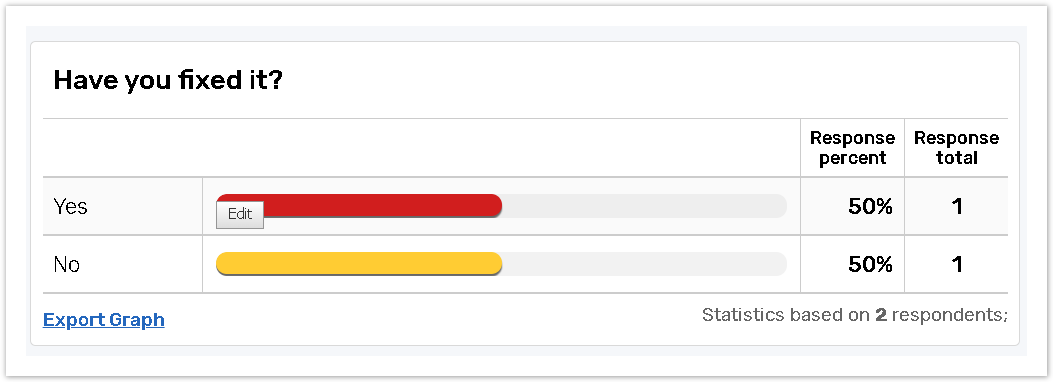
Click Preview to see how your time series graph or table is displayed.
-
Click the Edit Graph button to specify the parameters for your time series graph.
Please read the article for more information.
-
Save your changes.