Edit Dashboard Page
The Edit Dashboard page allows you to change the Dashboard's Name and Title, edit Charts, select the design color palette, set up Data and User filters.
This article contains links to pages with full instructions that will help you to adjust and edit Dashboards.
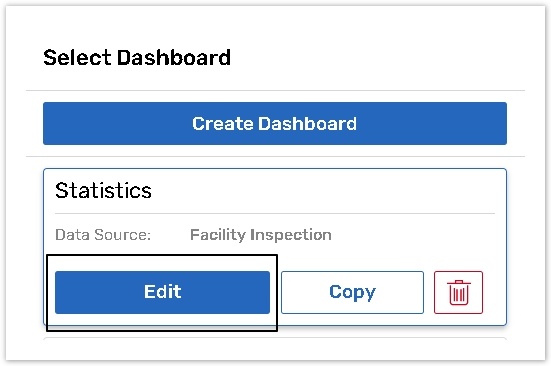
On the Dashboard page, click the Edit button on the right panel with the list of Dashboards.
The page consists of 2 panels: Left and Right.
Left Panel
.png?inst-v=5c056e1e-ae23-46ea-99ee-f3d1279e23b0)
The Left panel displays the Dashboard body Area. It allows you to change the position, resize and organize charts. Click on a chart to activate the Edit Chart panel.
Please read the Editing Charts article for more information.
Right Panel
.jpg?inst-v=5c056e1e-ae23-46ea-99ee-f3d1279e23b0)
The panel contains Design (1), Data Filters(2), User Filters (3) tabs and a collapsed Data Source(4) panel. Please click on each name of a tab for more information.
From this panel you can select colors for a Chart Palette, preview the Dashboard you’ve created via the Preview (6) button or Publish (5) it for viewers.
Click the Publish button to go to the Publish panel. The panel displays the Dashboard link, allows you to set up access to the Dashboard, and publish it to the Online Portal for selected contacts. For more information on publishing options, please visit the Publish Dashboard article.
The Right panel is displayed when you enter the Edit Dashboard mode and is replaced with the Edit Chart Panel once you start working with a chart.
To return to it, just click outside the chart boxes on the Dashboard Body Area.